Human population growth
Human population growth since 65 000 years
Reading the graph
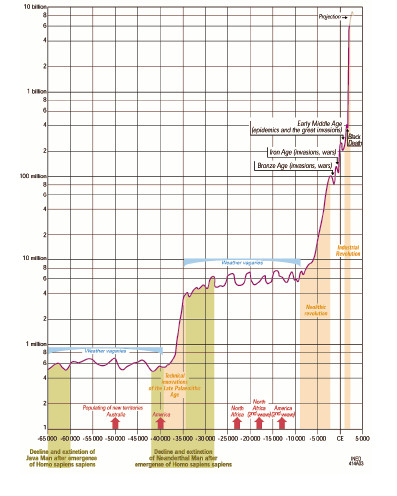
The horizontal axis of the graph represents time, from 65,000 BCE (Before Current Era) to the present. Periods of 5,000 years are separated by vertical lines.
The vertical axis shows the total size of the world population, which has grown spectacularly over the period. Between 50,000 BCE and the present day, the number of human beings has risen from around 600,000 to 6.5 billion, a ten thousand-fold increase.
To represent such large variations, a logarithmic scale is used for the y-coordinates on the vertical axis. This means that equal distances along the scale represent equal ratios of increase. The ordinates 100,000, 1 million, 10 million, 100 million, 1 billion and 10 billion are thus spaced at regular intervals, multiplied each time by a factor of ten.
The graph is thus semi-logarithmic, i.e. linear along the x-axis and logarithmic along the y-axis. It shows the relative rate of population growth. A population which grows at a constant rate is represented by a straight line on this graph, while actual population size increases exponentially.
Periods of long-term stability punctuated by episodes of rapid growth
Between 60,000 and 40,000 BCE, the human population rose and fell, but remained generally stable at around 600,000 individuals. It then began to increase rapidly, increasing ten-fold within a few thousand years thanks to improvements in hunting and fishing techniques. From around 10,000 BCE, the adoption of sedentary lifestyles, agriculture and livestock breeding gave rise to steady, long-term growth, interrupted only by war, epidemics or invasions. Since the eighteenth century, the demographic transition has led to unprecedented population growth and the curve has been practically vertical. In just 300 years, between 1700 and 2000, the world population was multiplied by ten.
Sources
These figures are highly approximate. They are based on a compilation of estimates made for each continent. The general shape of the curve is more certain.