Mobiliscope: an interactive tool for exploring your city around the clock!
Mobiliscope is a geovisualization tool used to analyze changes in who—in terms of social characteristics, activities, means of transportation used—is present in a given location over the course of the day and night.
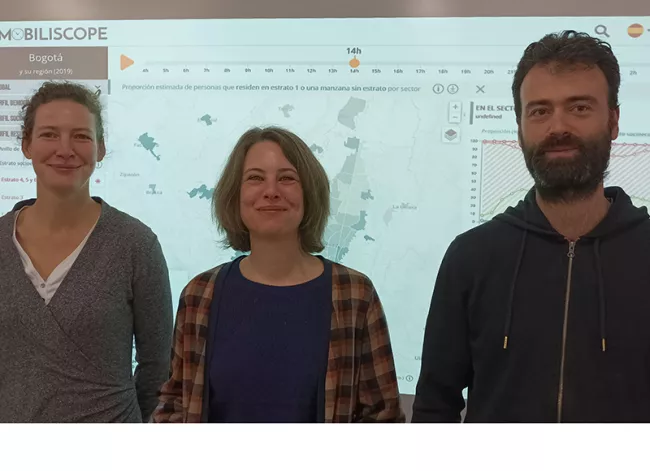
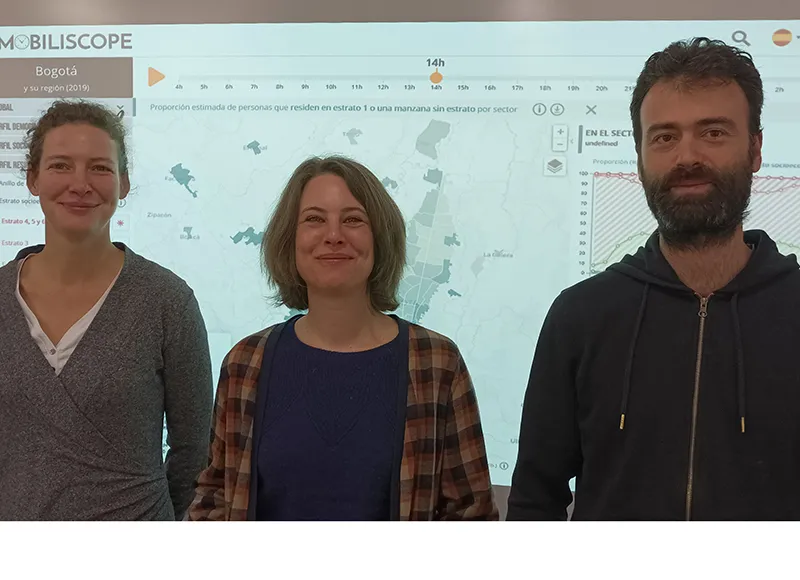
Senior researcher Julie Vallée and research engineer Aurélie Douet, both from the CNRS Geographie-cités research lab, and INED researcher Guillaume Le Roux present the tool and the ways it’s been further developed recently.
What’s Mobiliscope?
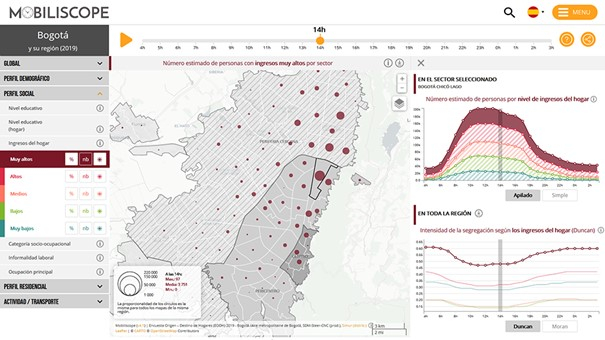
Mobiliscope is an open-access online tool that uses interactive maps and figures to show variations in people present in cities day and night as they move about to get to their places of work, schools, leisure activities, or go shopping. A major use of the tool is to measure the extent of social segregation within cities around the clock, thereby bringing to light districts hourly variations. Such space-time approach is in direct contrast to the static and residential perspective usually taken to describe urban areas and their social mix without accounting for people’s daily trips.
Mobiliscope can now be used to explore hourly variations of present population and social mix in 58 cities from 5 different countries.
What initial data does Mobiliscope use?
Mobiliscope team used trip data collected in the framework of large and representative households surveys. These surveys provide precise information not only on people’s trips (points of departure and of destination, times, purpose and mode of travel) but also on people’s demographic and social profile (sex, age, education level, income, etc.). We have first transformed trip dataset into location dataset and then aggregated these location data not only by hour and by district, but also according to people’s demographic and social profiles), their travel purpose and their mode of transportation.
Though Mobiliscope was developed using individual data —data that, with few exceptions, are not publicly accessible—it is perfectly within the limits of data protection rules to display aggregated location data since aggregation ensures anonymity for the initial respondents and protects their personal information. In fact, Mobiliscope offers users free and open access to hourly aggregated data that is “as openly available as possible and as confidential as necessary.”
How has Mobiliscope continued to be developed since it was first invented?
Mobiliscope has been in existence since 2017, when it was designed and developed by geographers and geomaticians at the Géographie-cités laboratory.
The first version was confined to Paris region and displayed two indicators to describe hourly variation of present population in every district: level of education and socio-occupational category. From 2018 to 2022, we enhanced the tool with other indicators, including age, sex, purpose of travel, and mode of transportation. Meanwhile, with funding from the Agence Nationale de la Cohésion des Territoires, 49 French city regions were gradually added. Through a partnership with Québec we were also able to add 6 Canadian city regions. Most recently, a partnership between the Géographie-cités lab and INED has enabled us to add 3 South American cities—Bogotá (Columbia), Santiago (Chile), São Paulo (Brazil)—that can now also be viewed online.
Can you tell us more about the new version of Mobiliscope, which just went online in April 2022? What have we learned from it?
For the three Latin American cities recently covered we have added an interface in Spanish and an indicator limited to those cities on whether people are formally or informally employed; we have also made the relevant data available on open access. With the new version, users can now freely explore hourly variations of social segregation in the three Latin American cities, all of which are characterized by intense social inequalities.
It turns out that regardless of time of day, social segregation (eg. according to household income) is much more intense in Bogotá, Santiago, and São Paulo than what’s been found in French or Canadian cities. Furthermore, the use of soft modes of transportation (walking, cycling) involves different rationales in Latin American cities: soft modes of transportation are used more often, proportionally, in working-class neighborhoods on the outskirts of these three cities whereas in France and Canada they are primarily used in city centers.
What’s more, the new version features another new indicator applicable to all 58 cities included in the tool: household composition. This additional information offers new angles for comparison between city regions.
