Mobiliscope (mobiliscope.cnrs.fr) is an open online geographic visualization tool that can be used to explore the daily rhythms and population’s social mix within city regions. Who regularly goes to what urban neighborhood or district? What transportation modes do they use to get there? Which areas are particularly attractive? How wide and intense is spatial segregation between rich and poor? Mobiliscope’s answers to these and many other questions vary by time of day. The tool was designed and developed in 2017 by a CNRS team[1]. Now, thanks to INED’s efforts, it has been extended to three major Latin American cities, opening the way for comparative analyses and demonstrating that the methodology can be replicated for a great number of cities across the world.
Mobiliscope allows to explore people’s locations around the clock within a great number of cities — including now three major Latin America ones
Mobiliscope is a geo-visualization tool that uses maps and interactive figures to show around-the-clock changes in the people and social groups that are present in given city neighborhoods or districts. It allows to measure and analyze variations in neighborhood social composition throughout the day and trends in urban segregation intensity by a range of socio-demographic characteristics.
The new version of Mobiliscope was developed in the framework of a three-year partnership that began in 2021 between the Géographie-cités laboratory2 and INED, both located on Campus Condorcet in Aubervilliers (France). Now, in addition to the 49 French and six Canadian city regions already accessible, it covers three major Latin American city regions: Bogotá (Columbia), Santiago (Chile), and São Paulo (Brazil). There are also new indicators, such as household composition, now available for all cities, and informal employment, available for Bogotá and São Paolo.
The geographical extension of Mobiliscope demonstrates that the methodology initially developed by the team is not specific to a given country but may be replicated and used in a great number of cities from different regions across the world using local survey data. The daily rhythms of a rising number of cities in different countries may now be studied comparatively, an approach further facilitated by the three-language interface—French, English, and Spanish—and the fact that all Mobiliscope data and procedures are available in open access.
Researchers, policymakers and transportation actors have a state-of-the-art instrument for designing public policies that will be well adapted to the daily time frames of the populations that move and spend time in specific areas.
SOME FIRST FINDINGS OBTAINED WITH THE NEW MOBILISCOPE: - In all three Latin American cities (Bogotá, Santiago, São Paulo), individuals’ socioeconomic profiles are what account for the sharpest spatial segregation. Privileged social groups (the rich, the educated, managers) are systematically more concentrated in cities than other social groups, regardless of time of day. These groups’ levels of segregation are also much higher in the Latin American cities than in French or Canadian ones.
- As in the central districts of France’s largest cities (Paris, Lyon, Marseille), managers in the South American cities arrive and depart from their central, attractive districts at different times than other socio-occupational categories. Managers and people in higher intellectual professions arrive later and leave later than less skilled workers.
- Gender segregation in the three Latin American cities is comparable to that in French and Canadian cities. The proportion of women present at night is very nearly identical in all neighborhoods, while differences are greater during the day. In the Latin American cities as elsewhere, the sex-ratio of people present in neighborhoods changes during the day. In some neighborhoods the majority of people present are men; in others, women.
- In all cities covered, the spatial dispersion of the population varies by the type of household people live in. People who live alone are more concentrated in certain areas at night. Still, even during the day the spatial concentration of this population subgroup tends to be higher than that of people living in families.
- The use of soft modes of transportation (walking, cycling) involves different rationales in Latin American cities on the one hand, French or Canadian ones on the other. In the former, soft modes of transportation are used more often, proportionally, in working-class neighborhoods on the outskirts of the city whereas in France and Canada they are used primarily by present population in city centers.
- In the three Latin American cities, the segregation of workers in the formal sector (a new indicator specific to these cities and accounting, by our estimates, for 36% of the occupied population in São Paulo and 45% in Bogotá) and of self-employed workers (an estimated 20% of the occupied population in Santiago, 28% in Bogotá, and 30% in São Paulo) increases sharply during the day (with heavy spatial concentration in the city outskirts), in direct contrast to other occupational categories, who are less spatially segregated during the day.
|
For more information and to access Mobiliscope, see mobiliscope.cnrs.fr/eng
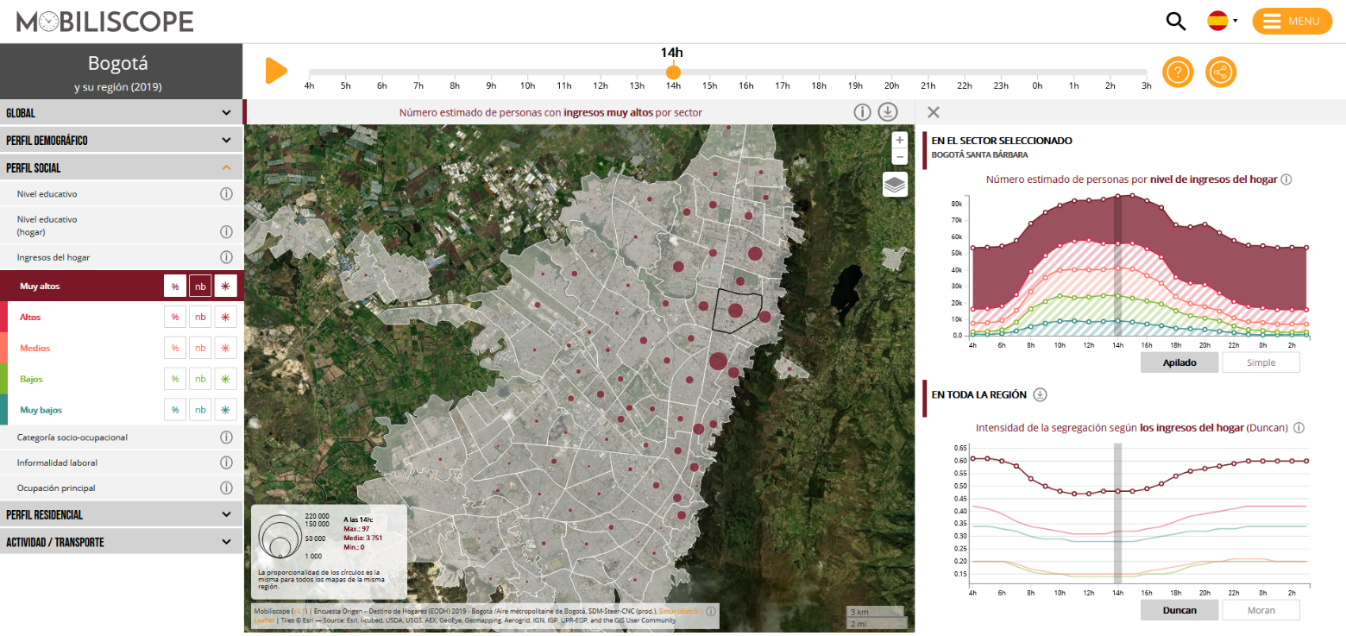
Bogotá (Spanish version) Map of number of high-income people by district at 2 pm. The figure on the upper right details variation in social composition in the Santa Barbara neighborhood by income level of the population in it at the given time. The figure on the lower right illustrates the decrease in segregation by income level throughout the Bogotá region between the hours of 8 am and 6 pm.
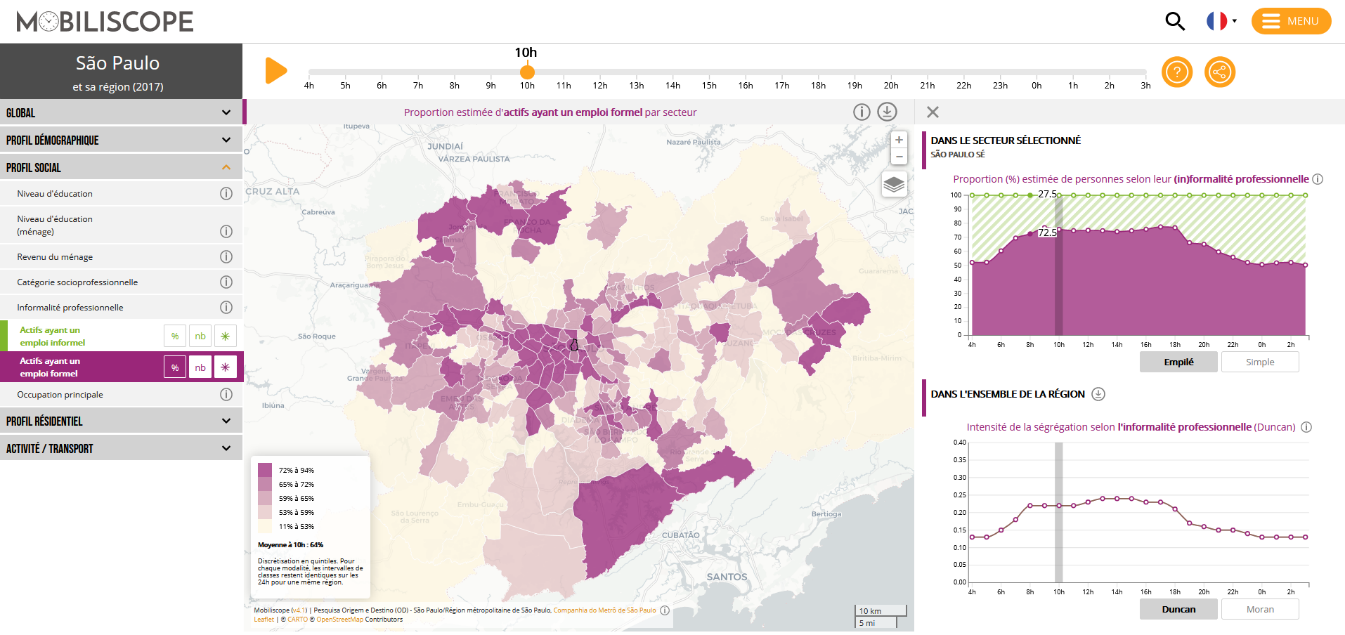
São Paulo (French version) Map of the proportion of workers in the formal sector by district at 10 am. The upper figure details daily variations in that proportion in a central district. The lower figure shows that workers in the formal sector are approximately twice as concentrated in some districts during the day than at night.
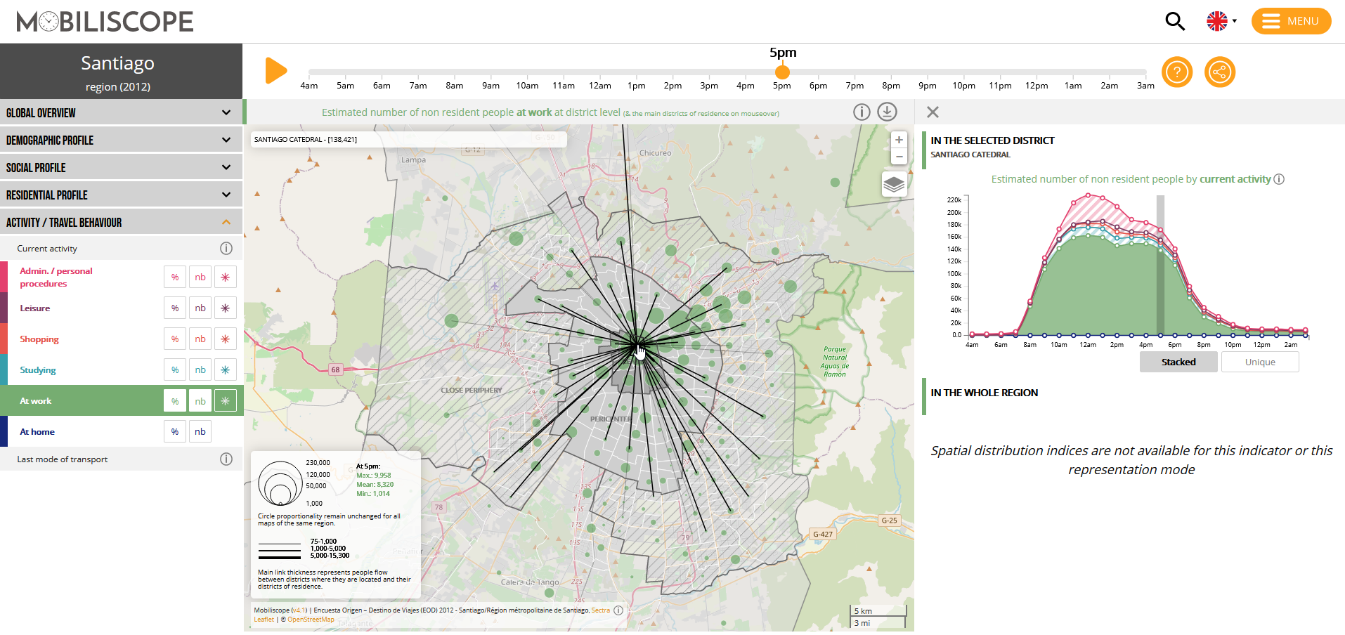
Santiago (English version) Map of the number of non-residents present in their place of work at 5 pm, by district. The lines radiating outward from the selected district (Catedral) extend to those people’s districts of residence.