Mapping the massive global fertility decline over the last 20 years. A radical change in the geography of fertility
Press release Published on 31 January 2024
Authors: Christian Vandermotten (Université libre de Bruxelles et Académie royale des Sciences, des Lettres et des Beaux-Arts de Belgique), Christian Dessouroux (Université libre de Bruxelles).
According to the United Nations median projection, the world population will continue to increase over the next 6 decades. However, this growth will probably be slowed by the rapid fertility decline currently under way. In 2021, the worldwide total fertility rate (TFR) was 2.3 children per woman, down from 5.1 in 1965, 3.7 in 1980, and 2.8 in 2000. The speed of decline has also accelerated since 2015.
Two-thirds of the world population with below-replacement fertility
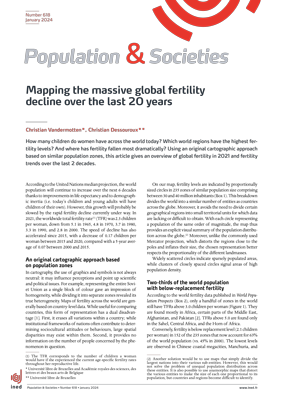
The geography of fertility has changed radically over the last 20 years. The world fertility map illustrates the major fertility decline across the world, including in Africa, over the last 2 decades. In 2021, almost two-thirds of the world population lived in zones where fertility is now below replacement level. The lowest levels are observed in Chinese coastal megacities, Manchuria, and South Korea, where the TFR is below one child per woman. The low-fertility category, which already included the populations of Europe and eastern Asia in the 2000s, now also encompasses almost all the Americas, a large part of India, Indonesia and, recently, the Philippines.
The fertility data used in this study, drawn from the 2022 edition of World Population Prospects and other databases, provide a means to analyse regional variations within the most populated countries. In India, for example, infra-national contrasts are striking: while in southern and western India and in Bengal, the TFR is below 2.1 almost everywhere, it is between 2.3 and 3 in the poor states of the Ganges valley.
Only a handful of zones in the world still have TFRs above 3.0 children per woman. They are found mostly in Africa, certain parts of the Middle East, Afghanistan, and Pakistan. TFRs above 5.0 are found only in the Sahel, Central Africa, and the Horn of Africa.
Fertility is now declining in practically all high-fertility zones
High-fertility zones (more than 3.5 children per woman) now represent just 16.1% of the world population. The factors behind the onset of this recent decline include an increase in age at marriage, wider (but still far from universal) school enrolment for girls, greater female labour market participation, and better access to contraception (although the speed of diffusion varies across countries). Lower infant mortality also reduces ‘demand’ for births.
A variety of profiles in low- and moderate-fertility zones
Low-fertility zones (TFR between 1.7 and 2.1) accounted for 22.6% of the world population in 2021.
They include zones of developed countries where birth control is long-established but where fertility remained above 2.1 children for many years (France, inland United States, Australia, and the southern cone of Latin America) and zones in Southern countries where fertility has fallen sharply from levels often still above 3.0 children per woman in 2000. These may be peripheral regions converging towards the national fertility model (in Iran, Türkiye, and China) or, conversely, pioneer zones of the national fertility transition in India, Southeast Asia, and Indonesia (Java). They also include the Gulf states.
In 2021, moderate-fertility zones (TFR between 2.1 and 3.5) accounted for 20.5% of the world population. The transition, while well advanced, is slowed by religious and cultural inertia, and sometimes by the obstacles to labour market participation for educated women (Morocco, Egypt, South Africa, Near East, and the Karachi region).
| An original cartographic approach based on population zones Applying an original approach, the maps described here represent the diverse fertility levels of the world population, independently of national boundaries, via proportionally sized circles across 235 zones of similar population size comprising between 30 and 40 million inhabitants. This breakdown divides the world into a similar number of entities as countries across the globe. Moreover, it avoids the need to divide certain geographical regions into small territorial units for which data are lacking or difficult to obtain. |
Authors: Christian Vandermotten (Université libre de Bruxelles et Académie royale des Sciences, des Lettres et des Beaux-Arts de Belgique), Christian Dessouroux (Université libre de Bruxelles).


